Guide
Add Tiles to a Dashboard
Although Rencore Governance comes with many Dashboards that come with a selection of tiles already assigned, you may wish to add additional tiles to these dashboards or create your own dashboards with a selection of chosen tiles.
In order to do this, you will need to:
- Click on the Dashboard selector and choose the dashboard you want to add a tile.
- Once in the chosen dashboard, click “Add tile”.
- On the next screen, you are able to narrow down the list of preconfigured tiles or create a custom tile.
Adding a Preconfigured Tile
In order to narrow the search for preconfigured tiles, you can do one of the following:
- Click in the search field and search by name.
- Click in the Services field to narrow down the list via “Services” by either Microsoft 365 | Teams | Power Automate | Power Apps | SharePoint | OneDrive | Exchange | Viva Engage | Entra ID.
- Click in the Category field to narrow down the list via “Category” by either Operations | Declutter | Costs | Adoption | External Access | Security | User Offloading | Power Automate .
- Click in the Type field to narrow down the list via type by Report | Policy | Inventory tiles. Once you have narrowed down the tiles that you want to add to the Dashboard, hover over the tile and click “Add tile to dashboard”.
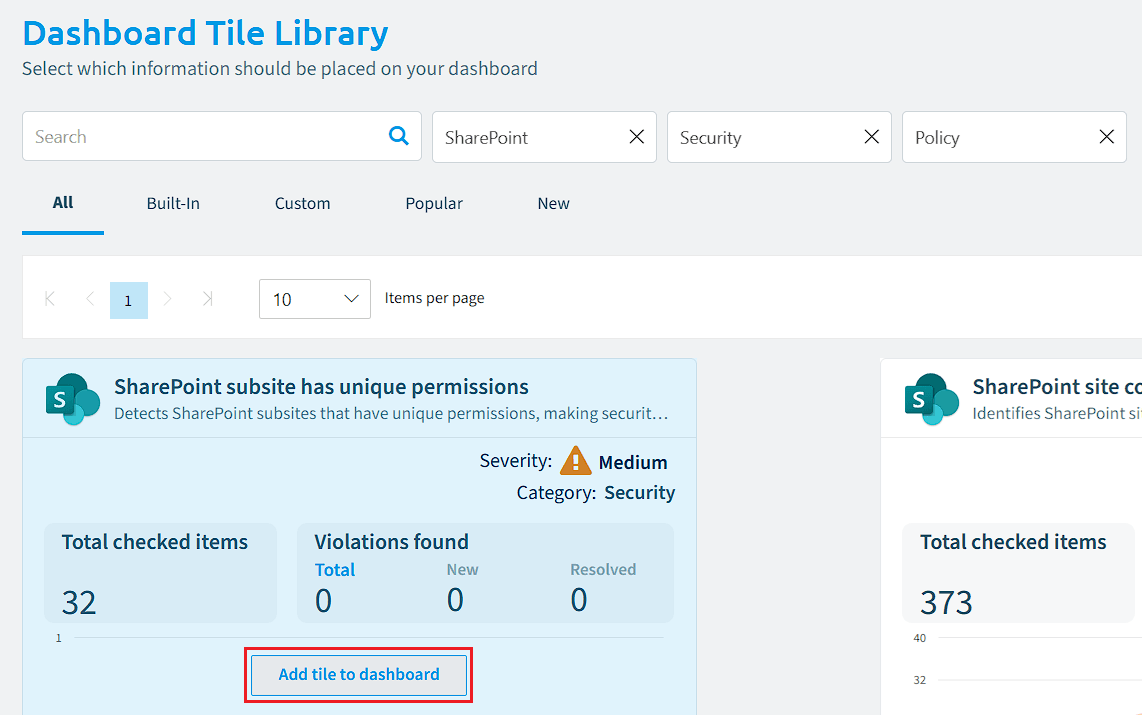
- Update the dashboard tile name and click “Save”. Repeat these steps for any additional tiles you wish to add.
Adding a Custom Tile to a Dashboard
- Click “Create Custom Tile”.
- Select either;
Tile: Create intuitive tiles to display inventory figures or policies, either individually, in summary form, or as a list.
-
After selecting “Tile”, choose between Inventory or Policy.
-
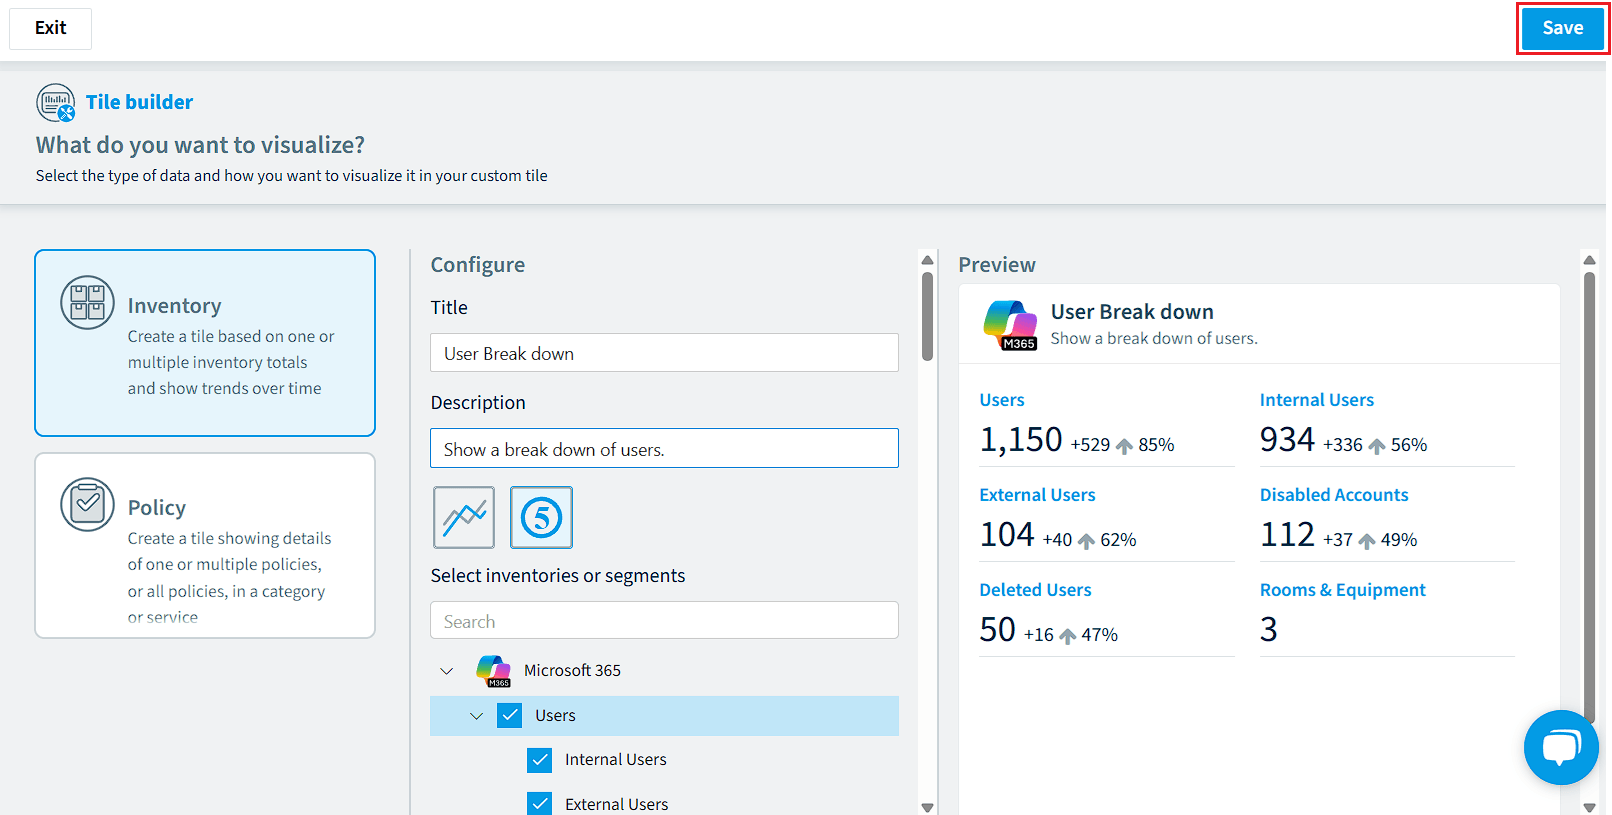
After selecting Inventory, provide a title and description of the tile.
-
Select
 to display a single inventory item, including a trend graph.
 -
Select
 to display multiple inventory items.
 -
Once the desired inventory or inventories click “Save”.
-
-
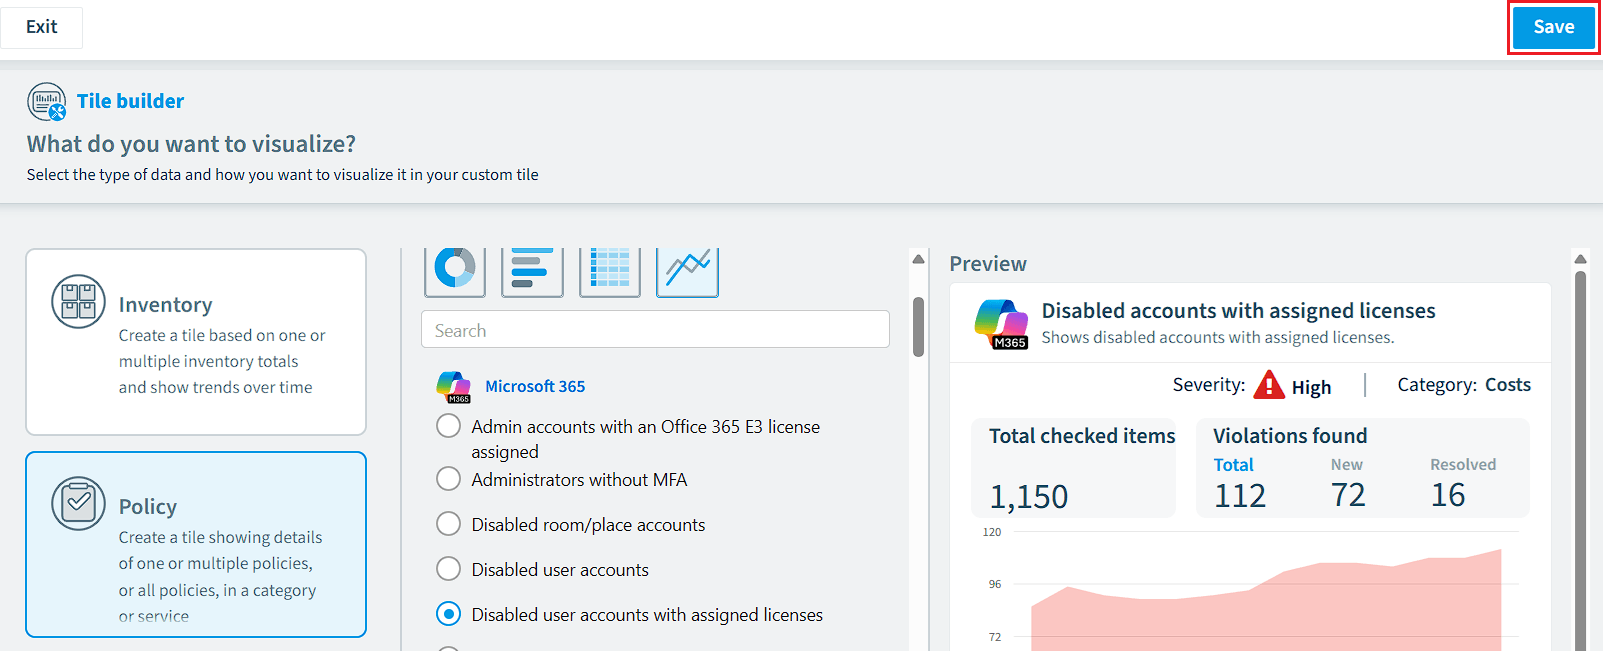
After selecting Policy, provide a title and description of the tile.
-
Select the desired report visual between Donut, Bar, or list for a summary of all policies matching the desired Service, Category, Severity, or Manual (where you can select the desired policies). Selecting
will permit the selection of only one policy, but the tile will display details of the policy. -
Once the desired policy or policies are selected, click “Save”.
-
-
Report: Create a tile from reports that showcases one or more inventories using rich visualizations such as charts or lists.
- After selecting “Report”, the system will load the report generator. Create a Report for the tile. For more details about creating a report, please view the knowledge base article: Create a Custom Report.
- Once the report is configured, click “Save”.