Guide
Create a Report from a Template
In order to add reports to your governance, you need to:
- Click on “Reports” on the Nav Panel.
- Click on “Add Report”.
This will take you to the “Report Template Library”. In the “Report Template Library”, you can search for a template, by narrowing down the list of templates by Service, Category, and Type.

It is also possible to create a Custom Report.
In order to create a report based on a template, choose the template that you want to use this will load the “Report Builder” screen.
On the Logic screen:
-
Check the object that the report is focused on.
-
Review or edit the Filter condition for the report. It is possible to add multiple configurable parameters by using the
“AND/OR” attributes and also add additional objects to the logic if required.
-
Click the “Preview” button to see a selection of the results from the logic.
-
Once happy with the logic, click “Next” in the top right corner.

Note: The maximum number of possible group conditions is 10.
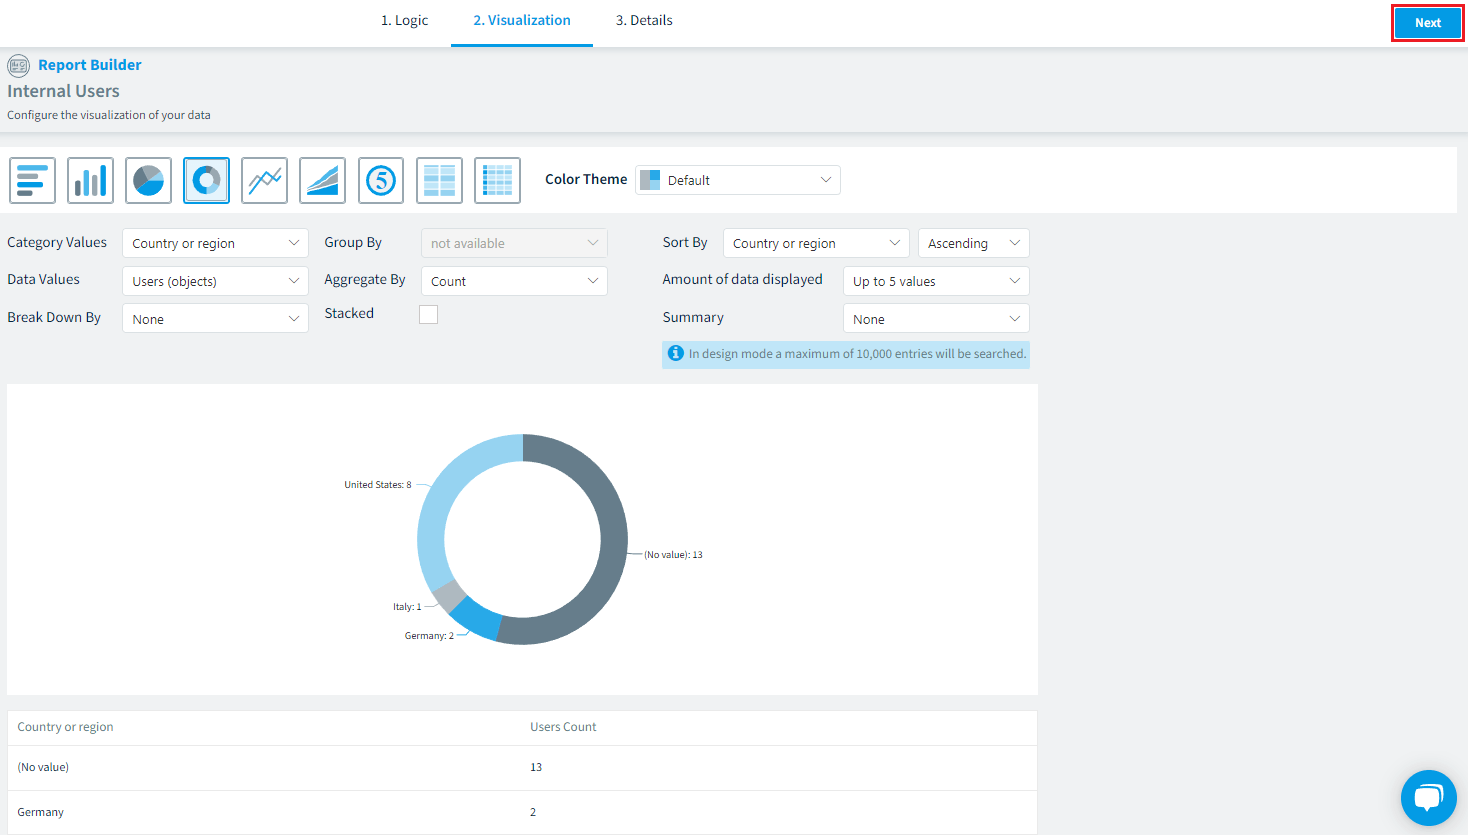
On the Visualization screen:
-
Select the style of chart for the report, this can be a bar Chart, Column Chart, Pie Chart, Donut Chart, Line Chart, Area Chart, KPIs, Table, and List.
-
Select the Color Theme for the report: Default, Severity colors, Blue monotone, Grey monotone, Green monotone, warm colors, and High contrast.
-
Select the elements on how you want the report to be broken down and displayed. By default, Data Values show the object that the report is focused on. You can also set the Category Values, Break Down By, Group By, and Aggregate By. You can also select how the report is sorted and the amount of data shown.
-
Once happy with the visualization of the report, click “Next” in the top right corner.
On the Details screen:
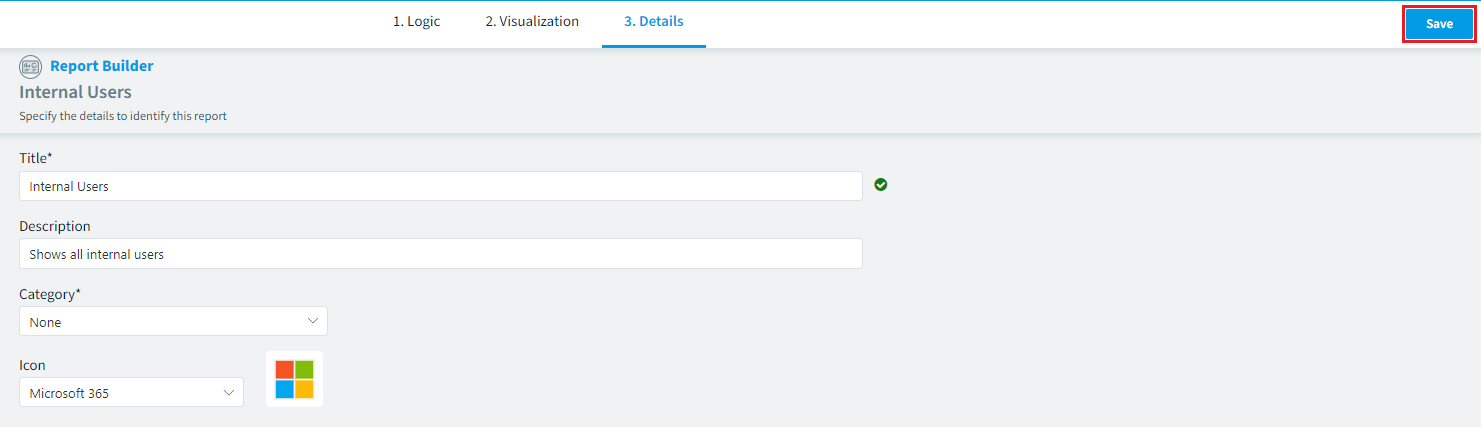
-
In the “Title” field, enter a unique name for the report.
A Green tick will appear when the title is unique, allowing you to proceed and save the report.
-
In the “Description” field, enter a description for the report.
-
Review the “Category” for the report or select a new one from the drop-down.
-
Review the Icon for the report or select a new one from the drop-down. This is usually the service that the object belongs to.
-
Once happy with the details and the report, click “Save” in the top right corner.
After clicking “Save”, the report will begin gathering data and display the results based on the data from the last scan.