
Plugin usage by user
AI summary
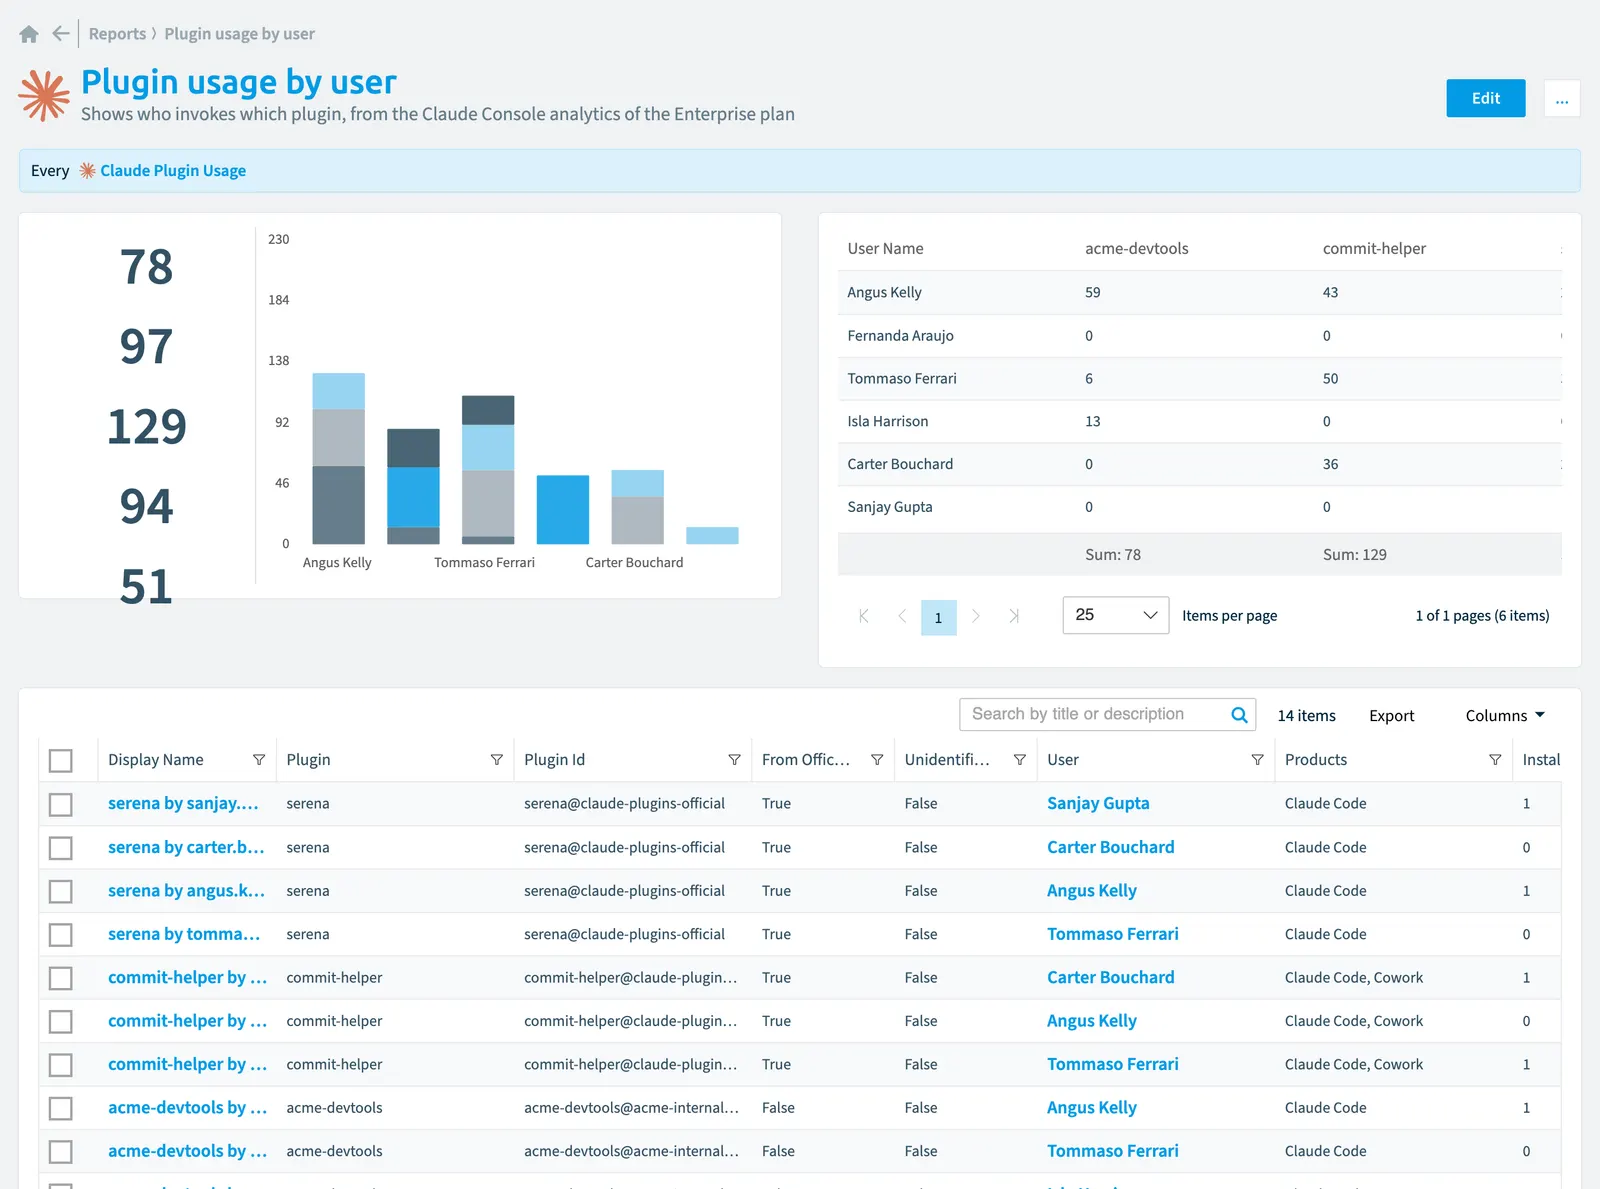
View which users invoke which Claude plugins based on invocation counts over the last 30 days to track adoption across your organization. The chart groups usage by user name and displays the top 10 plugins by invocation count.
Shows who invokes which plugin, from the Claude Console analytics of the Enterprise planPlanA Plan is the edition of Rencore Governance in your Subscription: Professional, Premium or Enterprise.Read more.
What it shows
The report shows Claude plugin usage objects from the Claude EnterpriseClaude EnterpriseClaude Enterprise is the business plan of the Claude AI assistant by Anthropic.Read more inventory.
The rule
Every Claude Plugin Usage
Chart
| Chart type | Column chart |
|---|---|
| Grouped by | User Name |
| Measure | Sum of Invocations (30d) |
| Broken down by | Plugin |
| Sorted by | Invocations (30d), descending |
| Limit | Top 10 |
In Rencore Governance
Details
| Reports on | Claude plugin usage |
|---|---|
| Connector | Claude Enterprise |
| Category | Adoption |
| Chart type | Column chart |
| Recommended | Yes |
| Status | Preview |
Other reports for this object
Frequently asked questions
What does the plugin usage by user report show?
The Plugin usage by user report: shows who invokes which plugin, from the Claude Console analytics of the Enterprise plan.
What is the rule of the plugin usage by user report?
Every Claude Plugin Usage.
Which objects does the plugin usage by user report use?
The Plugin usage by user report works on Claude plugin usage objects from the Claude Enterprise inventory and shows them as a column chart.
Which module includes the plugin usage by user report?
The Plugin usage by user report comes with the Claude Enterprise connector (in preview) in the AI & Agents module of Rencore Governance, an add-on module on the Premium and Enterprise Plans.
Was this page helpful?
Thanks for the feedback.
Thanks. What was wrong?