
Content consumption metrics
AI summary
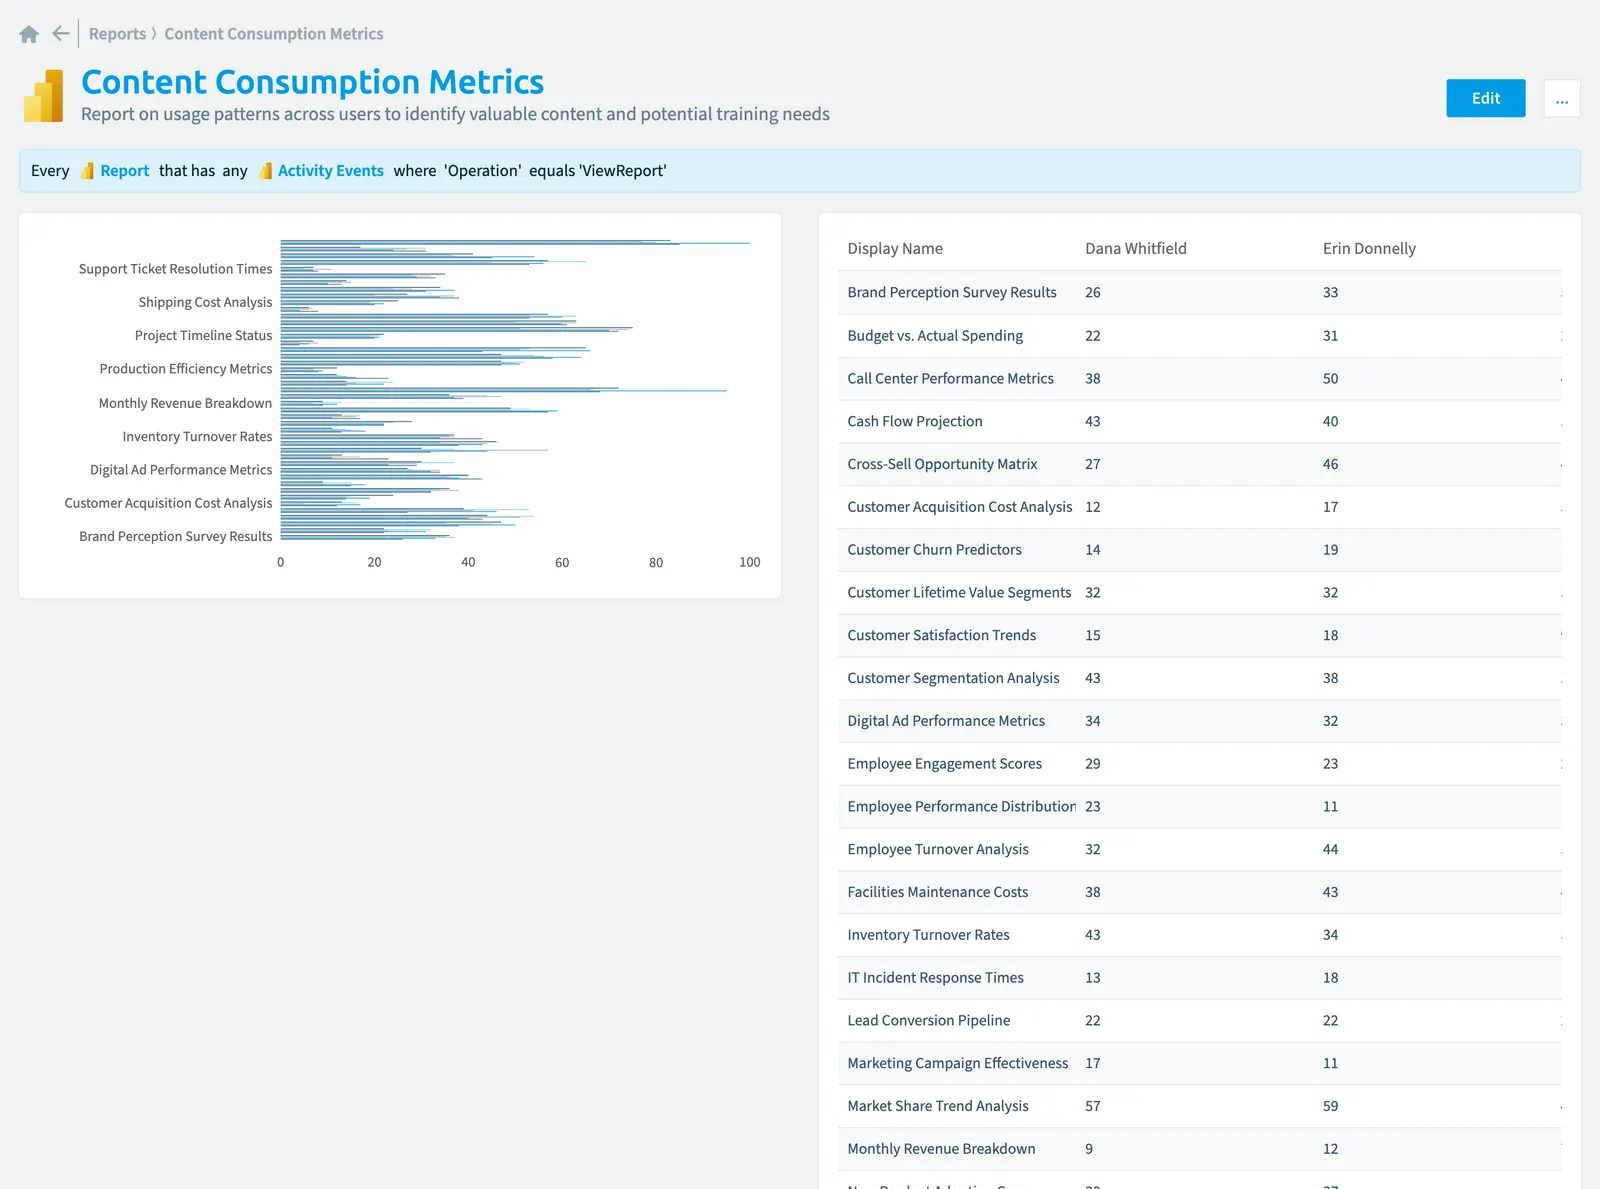
This report shows Power BI report usage patterns across your organization to help identify valuable content and training needs. The bar chart displays the top 50 reports ranked by number of views.
Report on usage patterns across users to identify valuable content and potential training needs.
What it shows
The report shows Report objects from the Power BIPower BIPower BI is the Microsoft service for reports and dashboards over business data.Read more inventory.
The rule
Every Report that has any Activity Events where Operation equals 'ViewReport'
Chart
| Chart type | Bar chart |
|---|---|
| Grouped by | Display Name |
| Measure | Number of Report objects |
| Broken down by | Report |
| Sorted by | Display Name, ascending |
| Limit | Top 50 |
In Rencore Governance
Details
Frequently asked questions
What does the content consumption metrics report show?
The Content consumption metrics report: report on usage patterns across users to identify valuable content and potential training needs.
What is the rule of the content consumption metrics report?
Every Report that has any Activity Events where Operation equals 'ViewReport'.
Which objects does the content consumption metrics report use?
The Content consumption metrics report works on Report objects from the Power BI inventory and shows them as a bar chart.
Which module includes the content consumption metrics report?
The Content consumption metrics report comes with the Power BI connector in the Apps, Automation & BI module of Rencore Governance, an add-on module on the Premium and Enterprise Plans.
Was this page helpful?
Thanks for the feedback.
Thanks. What was wrong?