
ChatGPT spend per week
AI summary
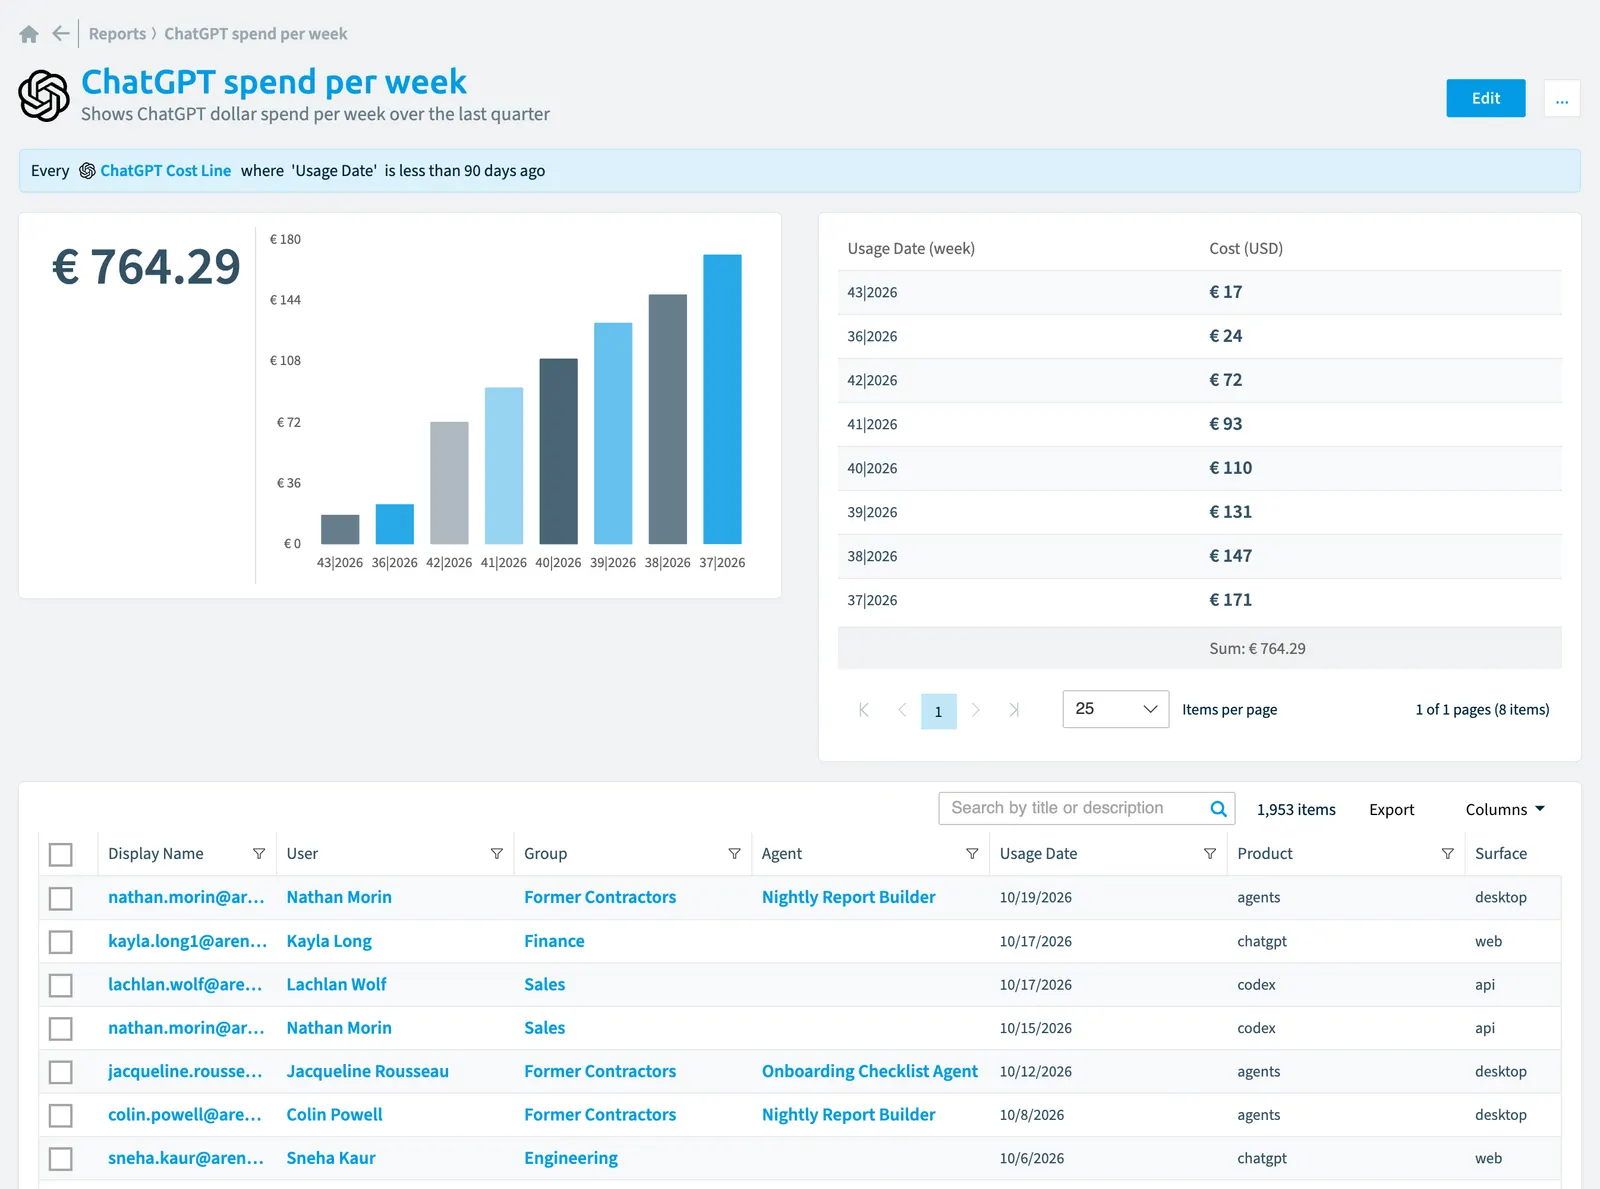
ChatGPT spend per week is a report in Rencore Governance showing your ChatGPT spending by week over the last quarter. The column chart helps you track spending trends from your ChatGPT Enterprise inventory.
"ChatGPTChatGPT EnterpriseChatGPT Enterprise is the business plan of the ChatGPT AI assistant by OpenAI.Read more spend per week" is a report for ChatGPT Enterprise in Rencore Governance. Shows ChatGPT dollar spend per week over the last quarter.
What it shows
The report shows ChatGPT cost line objects from the ChatGPT Enterprise inventory.
The rule
Every ChatGPT Cost Line where Usage Date is less than 90 days ago
Chart
| Chart type | Column chart |
|---|---|
| Grouped by | Usage Date |
| Measure | Sum of Cost (USD) |
| Sorted by | Cost (USD), ascending |
| Limit | Top 13 |
In Rencore Governance
Details
| Reports on | ChatGPT cost line |
|---|---|
| Connector | ChatGPT Enterprise |
| Category | Costs |
| Chart type | Column chart |
| Recommended | Yes |
| Status | Preview |
Frequently asked questions
What does the ChatGPT spend per week report show?
What does the ChatGPT spend per week report show?The ChatGPT spend per week report: shows ChatGPT dollar spend per week over the last quarter.
What is the rule of the ChatGPT spend per week report?
What is the rule of the ChatGPT spend per week report?Every ChatGPT Cost Line where Usage Date is less than 90 days ago.
Which objects does the ChatGPT spend per week report use?
Which objects does the ChatGPT spend per week report use?The ChatGPT spend per week report works on ChatGPT cost line objects from the ChatGPT Enterprise inventory and shows them as a column chart.
Which module includes the ChatGPT spend per week report?
Which module includes the ChatGPT spend per week report?The ChatGPT spend per week report comes with the ChatGPT Enterprise connector (in preview) in the AI & Agents module of Rencore Governance, an add-on module on the Premium and Enterprise Plans.
Was this page helpful?
Thanks for the feedback.
Thanks. What was wrong?